
How to Interpret Reliability Metrics
May 11th, 2021
Introduction
In this article we will show how you can interpret reliability metrics. These metrics can be confusing for those starting out in the field of reliability engineering as it can often be difficult to relate the numbers and graphs back to the real world, we will explain what the metrics are and show how they can be read from typical reliability curves.
Let’s start with Reliability
Reliability is the probability that an item can perform a required function under given conditions for a given period of time. It is important to note that therefore Reliability is a function of time; a function of conditions; and also requires a precise definition of failure. Reliability therefore should be reported with both a probability (either as a number between 0 to 1 or as a percentage 0% to 100%) and at a time e.g., a pump, which required to move water at 5 litres per second under normal operating conditions, is required to have a Reliability of at least 90% after 1 year of operation.
How about Unreliability
Unreliability is the probability that an item will fail to perform a given function under given conditions for a given period of time. It is clear that Unreliability is the opposite and therefore Unreliability is equal to 1 – Reliability. Unreliability is also known as “Probability of failure”.
Other metrics
As Reliability is a function of time it is common to see Reliability (or Unreliability) vs time plots. These plots can be used to read off several Reliability metrics (Reliability, Probability of Failure, Reliable Life, BX% Life) which are defined below:
- Reliability: The probability that a unit will operate successfully at a particular point in time.
- Probability of Failure: The probability that a unit will be failed at a particular point in time.
- Reliable Life (warranty time): The estimated time when the Reliability will be equal to a specified goal.
- B(X) Life: The estimated time when the probability of failure will reach a specified point (X%).
Acquiring these metrics from graphs
The definition of these four metrics can seem confusing however they directly relate to values which can be read off the below Reliability (or Unreliability) vs time plots:
- Reliability: Read up and across from a given point in time on a Reliability vs. Time plot.
- Probability of Failure: Read up and across from a given point in time on an Unreliability vs. Time plot.
- Reliable Life: Read across and down from a given Reliability on a Reliability vs. Time plot.
- B(X) Life: Read across and down from a given Unreliability on an Unreliability vs. Time plot.
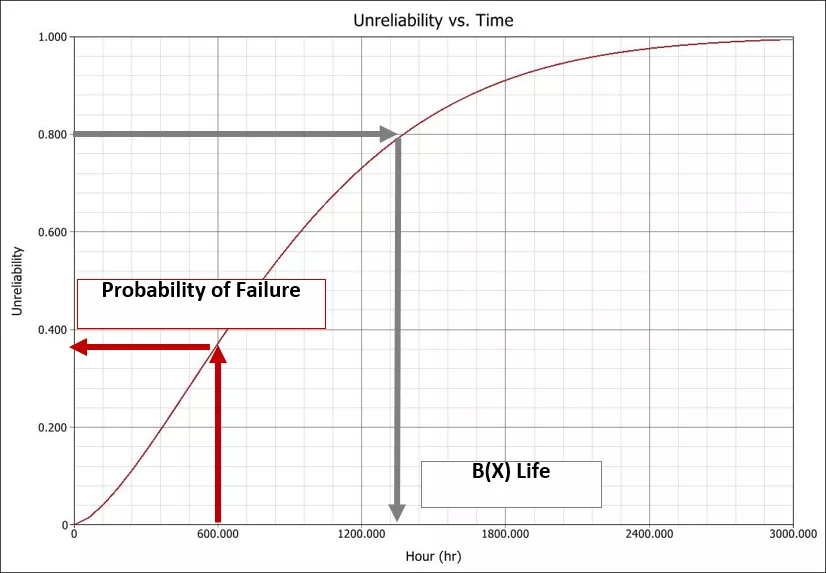

We can see now how the metrics Reliability and Reliable Life are two sides of the same coin. For example, if the Reliability for a unit at 600hrs is 60% then Reliable Life for 60% Reliability would be 600hrs. Similarly, Unreliability and B(X) Life are also two sides of the same coin and so, remembering Unreliability is equal to 1 – Reliability, for the same unit the Unreliability at 600hrs would be 40% and the B(40) Life would be 600hrs.
Summary
In this article we have introduced 4 key reliability metrics, and how to read them from typical reliability curves.
How we can help
Contact us on +44 (0) 333 996 9930 or email: info@wildeanalysis.co.uk to discuss your specific needs.